Year Over Year (YoY) Analysis: Guide, Calculation & Template
Table of Content:
- What is Year Over Year Analysis (YoY) Analysis
- Calculate Year Over Year (YoY) using Formula – with Examples
- Excel Template for Calculate Year Over Year Analysis (YoY)
- What is a Good YoY Growth Rate
- Industry Specific Averages of YoY Growth Rate
- Relationship of YoY and Seasonality
- Common Business and Financial Metrics
- Importance and Usage
- Substitutes
- Limitations
- Pros YoY Analysis
- Cons of YoY Analysis
- Real-World Examples of Companies that have Effectively Leveraged YoY Analysis
- How can I use the Output of YoY to Grow my Business?
- Best Practices when Calculating the YoY Analysis
What is Year Over Year Analysis (YoY) Analysis?
Year-Over-Year (YoY) is a type of financial analysis used to compare data between time series. It is a data comparison of one time period (ex: a month) against the comparable previous period (ex: the same month in the previous year). Year-Over-Year (YoY) analysis is used in economic and investment analysis and helps to comprehend the growth pattern from year to year.
As an example, an investor is keen to compare the performance of investment returns on a year-over-year basis to decide whether to invest or not, understand the growth pattern, and also choose the best with multiple investment options. By using YoY investor can easily make the decision of whether the investment provides good growth of the return.
One of the major benefits of using the Year-over-Year (YoY) approach is that you can analyze performance on an annual, quarterly, or even monthly basis as required. This method enables the comparison of statistics while accounting for seasonal variations, rather than relying solely on overall returns for evaluation.
As an example, Quarter 4 in any year (Jan, Feb, March) is a comparatively less performing quarter for most companies. Company management can do a YOY analysis to compare the current year’s Quarter 4 with the last year’s Quarter 4 to understand whether the company is growing (considering the seasonal factor), rather than comparing Quarter 4 with Quarters 3, 2, and 1 in the same year.
Another example is that: Most companies expected to improve sales in the December month of any year due to the Christmas season. Comparing the sales data of the December month between years will be more beneficial for the investors rather comparing the yearly total. Investors can easily figure out the revenue trend and growth while considering the seasonal factor.
Calculate Year Over Year (YoY) using Formula – with Examples
There are two approaches to calculating the Year-Over-Year (YoY),
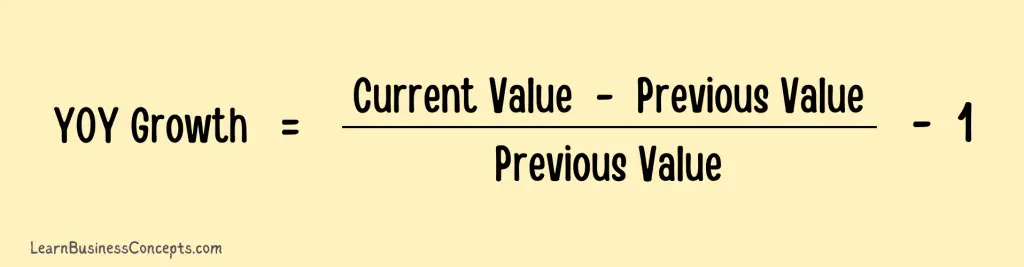
Approach 1: Current year value divided by the previous year’s value, subtract the result from 1
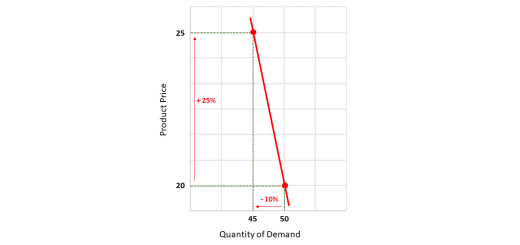
Example (a): If a return on investment was $10,000 in Year 2 and $12,500 in Year 2, the YOY growth can be calculated as ($12,500 / 10,000) – 1, resulting in 25%.
Example (b): Clothing company Year 1 December month sales were $63,000 and Year 2 December month sales were $78,000. The YOY growth can be calculated as ($78,000 / $63,000) – 1 = 23.8%.

Approach 2: Current value minus the previous value and then divide the result by the previous value
Example (a): if a return on investment was $10,000 in Year 2 and $12,500 in Year 1, the YOY growth can be calculated as ($12,500 – $10,000) / 10,000, resulting in 25%.
Example (b): Clothing company Year 1 December month sales were $63,000 and Year 2 December month sales were $78,000. The YOY growth can be calculated as ($78,000 – $63,000) / $63,000 = 23.8%.
Excel Template for Calculate Year Over Year Analysis (YoY)
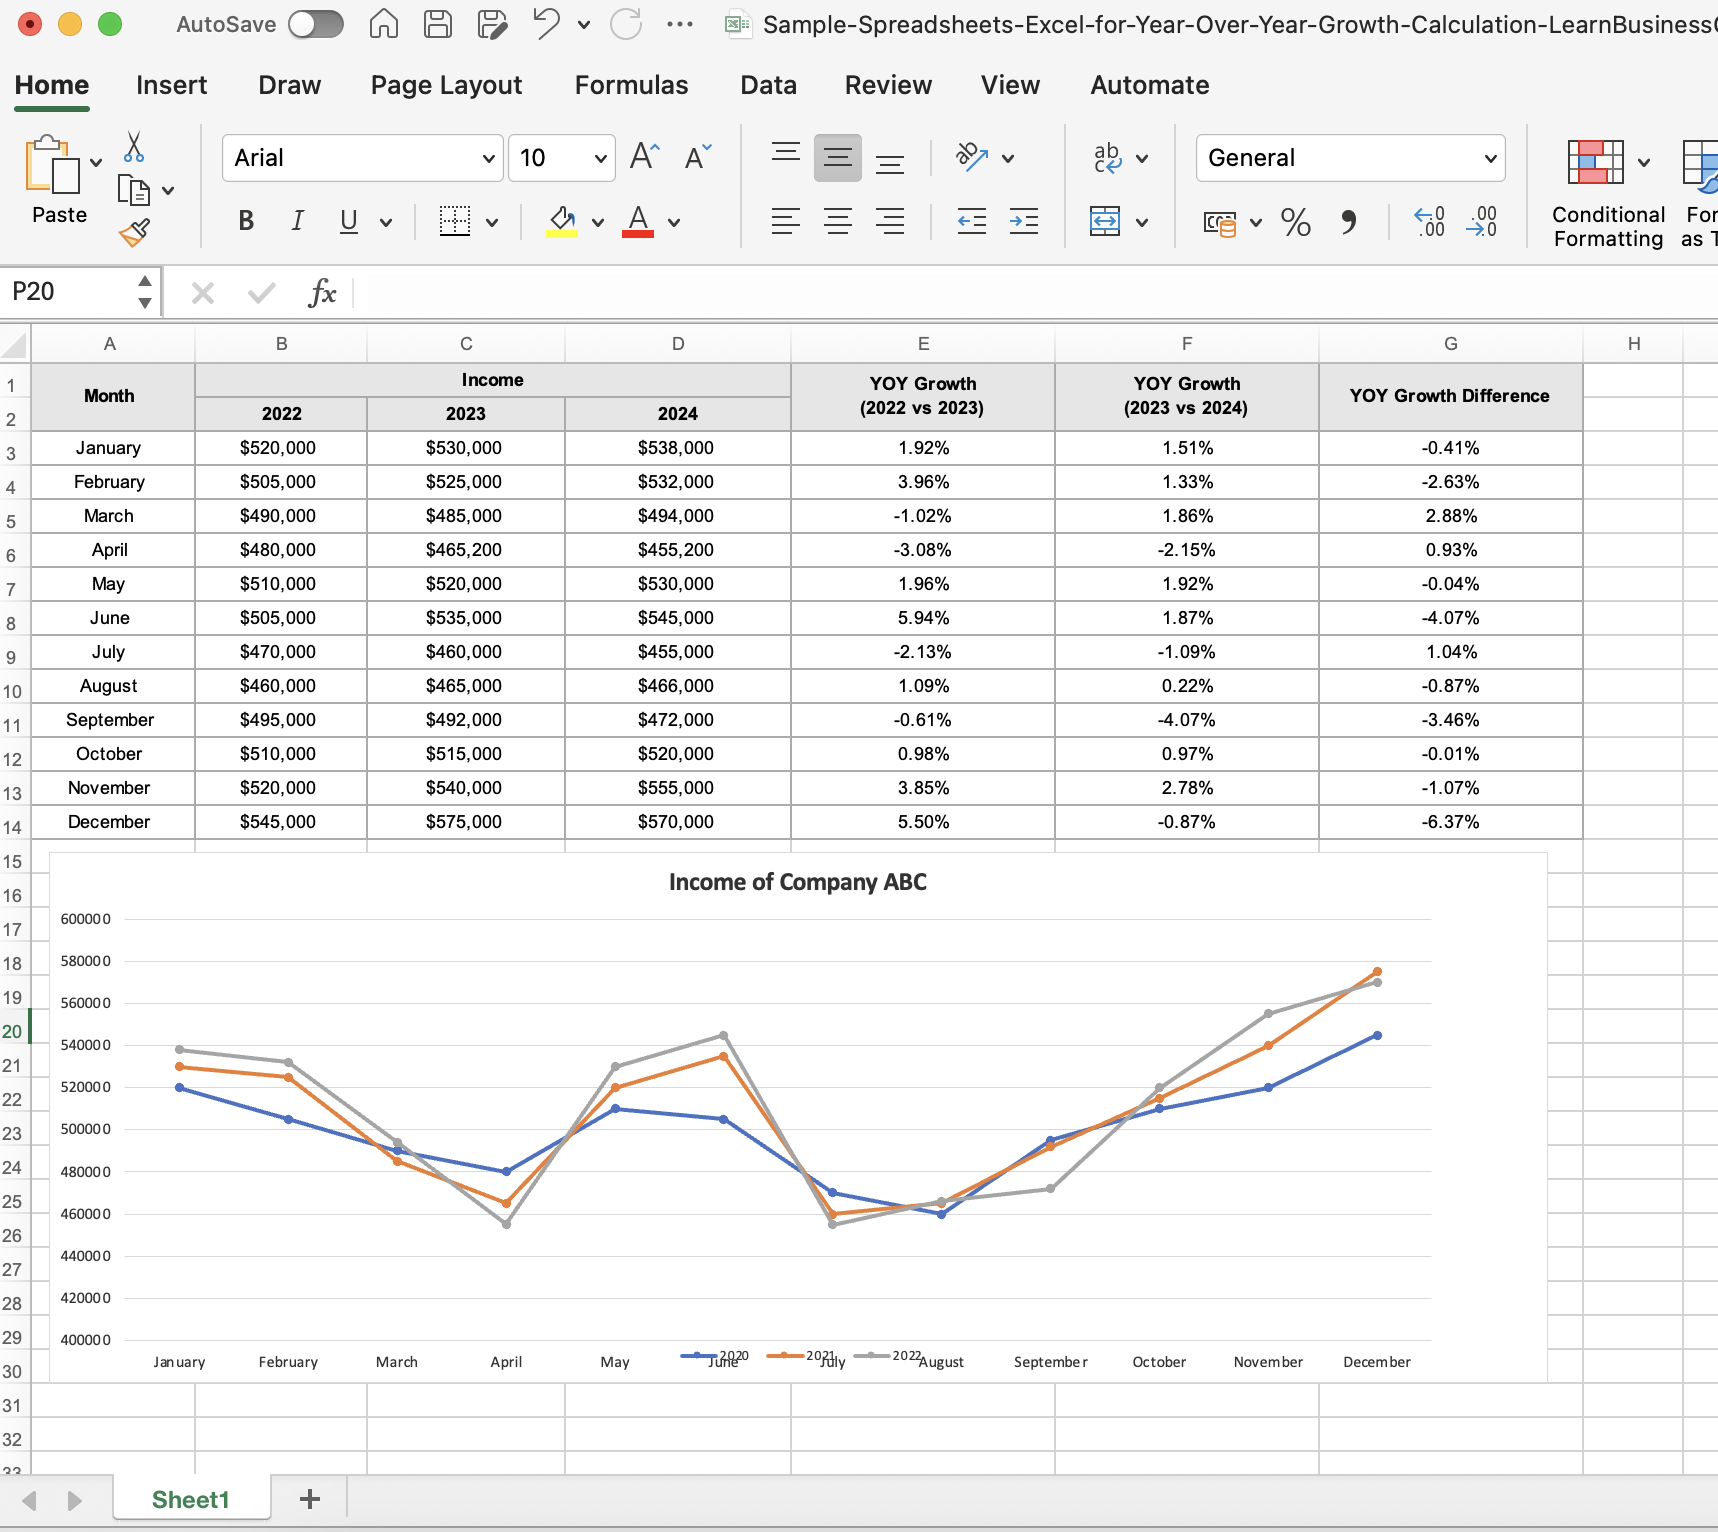
The below sample Excel (spreadsheet) template contains the monthly Year-Over-Year (YOY) calculation for three consecutive years. This is a fully editable file where you can download, comprehend, and amend this according to your preference.
What is a Good YoY Growth Rate
YoY growth rates provides the comparative analysis of the growth across several periods. The output of this formula is a percentage which reflects the growth compared with the previous period. Hence it is hard to provide a good YoY growth rate which common across industries and other factors. Generally an increase in YoY Growth Rate reflects positive outlook in growth. In comparison, a decrease in YoY Growth Rate reflects negative outlook in growth.
A good Year-over-Year (YoY) growth rate number depends on the industry, company size, and market conditions. There are certain benchmarks in the industry which we can consider as a good YoY growth rate,
- Startup and High-Growth Companies – A YoY growth rate of 20-50% or more is often considered excellent. In the Technology or SaaS sectors, growth rates as high as 100%+ can be common in the early stages.
- Small to Medium Businesses (SMBs) – A healthy growth rate typically ranges from 10-20%, reflecting steady expansion without overextending resources.
- Large Corporations – Mature companies often aim for 3-10% YoY growth. Sustaining even single-digit growth at this scale is impressive given market saturation and operational complexities.
Industry Specific Averages of YoY Growth Rate
- Technology and SaaS – 15–100%, higher for startups and early-stage companies.
- Healthcare – 5–20%, influenced by innovation and aging demographics.
- Retail – 3–30%, with e-commerce on the higher end.
- Manufacturing and Industrial – 2–8%, steady growth tied to demand and innovation.
- Finance and Banking – 3–50%, with fintech showing faster growth.
- Energy and Utilities – 2–30%, renewable energy leading the higher range.
- Travel and Hospitality – 5–20%, heavily influenced by economic cycles.
- Education – 2–25%, digital education platforms driving growth.
- Real Estate – 3–10%, dependent on economic and sector-specific trends.
- Media and Entertainment – 1–30%, streaming and gaming showing robust growth.
- E-commerce – 15-30% YoY growth is strong due to online shopping’s rapid adoption.
- Manufacturing – A modest 3-5% growth reflects stable performance.
- Retail – 5-10% is typical for established players.
Relationship of YoY and Seasonality
Year-over-year (YoY) comparison is a method which we can use to evaluate changes in certain variables over a 12-month period. This also means comparing the current period to the same period in the previous year. Seasonality refers to patterns or fluctuations that occur in data at regular intervals, typically within a year, due to factors such as weather, holidays, or cultural events.
YoY analysis is useful for seasonality as following,
- Sales: Retail sales has a strong relationship with seasonal patterns, such as higher sales during the holiday season, such as in November & December Months. If you compare current year February and December month growth it will not reflect the correct growth due to effect of seasonality. Hence you have to compare the sales of last year and current year December months to obtain the accurate figures of the growth.
- Weather-dependent industries: Certain industries, like agriculture or tourism, are heavily influenced by seasonal changes in weather. YoY comparisons in these industries must consider the variations in weather patterns to identify true impact of the changes.
- Consumer behavior: Seasonal factors, such as back-to-school shopping or summer vacations, can affect consumer spending patterns. YoY comparisons in consumer behavior metrics should factor in these seasonal influences to provide meaningful insights.
As per above examples, ignoring seasonality can lead to misinterpretation of data and flawed decision-making in YoY analysis. Techniques like seasonal adjustment or using seasonally adjusted data can help mitigate the effects of seasonality when making YoY comparisons.
Common Business and Financial Metrics of YoY
Following is the list of common business and financial metrics analyzed on a year-over-year (YoY) basis. These metrics offer valuable insights into different aspects of a business’s performance and are essential for making informed decisions, setting targets, and tracking progress over time.
1. Revenue YoY Growth
This is the percentage change in total revenue from the current period compared to the same period in the previous year. This metric is useful to measure the growth or decline in a company’s top-line revenue. This indicates the company’s ability to generate more revenue over time and assesses the effectiveness of sales and marketing efforts
Revenue YoY Growth Calculation = (Current Year Revenue − Previous Year Revenue) / Previous Year Revenue x 100
2. Profit YoY Growth
This is the percentage change in net profit or earnings from the current period compared to the same period in the previous year. This helps to evaluate the efficiency of operations and management’s ability to generate profits. This metric provides insight into the company’s profitability trends and helps assess overall financial health.
Profit YoY Growth Calculation = (Current Year Profit – Previous Year Profit) / Previous Year Profit x 100
3. Customer Acquisition YoY Growth
This metric reflects the percentage change in the number of customers acquired during the current period compared to the same period in the previous year. This measures the effectiveness of marketing and sales strategies in attracting new customers. Also this metric indicates the company’s ability to expand its customer base, which is crucial for sustainable growth.
Customer Acquisition YoY Growth Calculation = (Current Year New Customers – Previous Year New Customers) / Previous Year New Customers x 100
4. Customer Retention Rate YoY
This reflects the percentage of customers retained from the previous year. This is useful to evaluate the effectiveness of customer service, product quality, and overall customer satisfaction. High retention rates indicate customer loyalty and can lead to increased lifetime value and reduced marketing costs.
Customer Retention Rate YoY Calculation = (Number of Customers at End of Year – Number of New Customers Acquired During Year) / Number of Customers at Start of Year x 100
5. Inventory Turnover YoY
This reflect the number of times inventory is sold or used in a given period, compared to the previous year. This metric helps you to measures how efficiently a company manages its inventory and cash flow. High inventory turnover indicates strong sales and efficient inventory management, while low turnover may suggest excess inventory or slow-moving products.
Inventory Turnover Calculation = Cost of Goods Sold (COGS) / Average Inventory
Inventory Turnover YoY Calculation = (Current Year Inventory Turnover – Previous Year Inventory Turnover) / Previous Year Inventory Turnover x 100
6. Return on Investment (ROI) YoY
This is the percentage change in the return on investment from the current period compared to the same period in the previous year. This is useful to assesses the profitability of investments made by the company. This metric helps to evaluate the effectiveness of investment decisions and capital allocation strategies.
Return on Investment (ROI) YoY Calculation = (Current Year ROI – Previous Year ROI) / Previous Year ROI x 100
7. Employee Productivity YoY
This metrics provides the percentage change in employee productivity, typically measured as revenue or output per employee, compared to the previous year. This is useful to evaluates workforce efficiency and effectiveness. This indicates whether the company is getting more output from its workforce and can help identify areas for improvement in human resource management.
Employee Productivity YoY Calculation = Current Year Revenue or Output per Employe / Previous Year Revenue or Output per Employee x 100
Importance and Usage of Year Over Year (YoY)
1. Year Over Year (YoY) method is useful to compare any metric like investment return, revenue, profit, cost, sales quantity, sales returns, machine hours, waste, and employee hours worked.
2. Company management can view how the company operations have changed over the last year by comparing the company’s performance status at the same point in the previous year (ex: compare the current year’s January month with last year’s January month statistics).
3. Company financial metrics like sales and profits change during different periods of the year because most businesses have a high-demand season and a low-demand season. Month-to-month comparison helps to analyze performance in the same month in the year.
Example: December seasonal sales of this year versus last year, to understand whether the company has improved the sales compared with last year’s Christmas season.
4. The company board can baseline the company financials using the YOY analysis. By conducting the YOY analysis of the last couple of years in a row, the company’s board can establish the baseline revenue or other financial metric to provide a target to the management team.
5. Financial investors can use the YOY analysis to foresee the returns of their investment and decide whether to proceed with the investment or not.
Substitutes for YoY Analysis
There are some alternative approaches for YoY Analysis that can be used depending on the specific requirements.
1. Quarter-over-Quarter (QoQ) Analysis
This compares data from one quarter to the previous quarter within the same year. QoQ analysis provides insights into shorter-term trends and fluctuations within the year, whereas YoY analysis offers a broader view of changes over a full year, smoothing out seasonal variations.
2. Month-over-Month (MoM) Analysis
This compares data from one month to the previous month within the same year. MoM analysis offers even shorter-term insights into trends and fluctuations, which can be useful for identifying more immediate changes. However, it may be more susceptible to noise and short-term variations compared to YoY analysis.
3. Trend Analysis
This provides the analysis of data over multiple periods to identify long-term trends and patterns. Trend analysis focuses on identifying and extrapolating patterns over time, regardless of specific year-over-year comparisons. It provides insights into the overall direction of the data but may not capture short-term fluctuations as effectively as YoY analysis.
4. Seasonally Adjusted Analysis
This metric adjusts data to remove the effects of seasonal variations, allowing for more accurate comparisons across different periods. Seasonally adjusted analysis aims to isolate underlying trends by removing seasonal fluctuations, which can be beneficial when comparing data across different seasons or months. YoY analysis, on the other hand, captures both seasonal and non-seasonal changes.
5. Rolling Average Analysis
Calculates the average of data over a rolling period, such as a moving average over the past 3, 6, or 12 months. Rolling average analysis smooths out short-term fluctuations and can provide a clearer picture of trends over time. However, it may not capture the specific year-over-year changes as directly as YoY analysis.
6. Index Analysis
Expresses data relative to a base period or index value, allowing for comparisons across different time periods. Index analysis provides a relative comparison of data over time, which can be useful for tracking relative changes and performance. However, it may not capture the absolute magnitude of changes as YoY analysis does.
YoY analysis provides a broad view of changes over a full year and helps smooth out seasonal variations, but these alternatives offer more granular or specialized perspectives that may be better suited to certain contexts.
Limitations of YoY Analysis
- Short-Term Fluctuations Masked: YoY analysis smooths out short-term fluctuations by comparing data from the same period in different years. This is beneficial for identifying long-term trends, but it may obscure or mask short-term changes that could be important for decision-making.
- Seasonal Variations Not Fully Accounted For: YoY analysis does not directly account for seasonal variations in data. This can be a limitation when analyzing metrics that are heavily influenced by seasonality, such as retail sales or tourism. YoY comparisons may provide misleading insights without seasonally adjusting the data.
- Dependent on Historical Data Quality: The reliability and accuracy of YoY analysis depend on the quality of historical data. Inaccurate or incomplete historical data can skew YoY comparisons and lead to erroneous conclusions about trends or performance.
- Limited to Annual Comparison: YoY analysis compares data from one specific period to the same period in the previous year. This limits its ability to capture changes that occur at different times of the year or to assess performance on a more granular level, such as quarterly or monthly.
- Lack of Context for Changes: YoY analysis provides insights into changes over time but may not provide context for why those changes occurred. It will be challenging to understand the underlying factors driving the observed trends without additional information or analysis.
- Doesn’t Capture External Factors: YoY analysis focuses solely on changes within the business over time and may not account for external factors that influence performance, such as changes in the economy, industry dynamics, or regulatory environment. This can limit its ability to provide a holistic view of business performance.
- May Not Be Applicable to All Metrics: YoY analysis is most effective for metrics that exhibit consistent patterns or trends over time. YoY analysis may not provide meaningful insights and could lead to misinterpretation of data for metrics with high volatility or irregular patterns.
Pros of Year Over Year (YoY) Analysis
- Helps Mitigate Seasonal Factors: YoY analysis compares data from the same period in different years, which helps to mitigate the seasonal variations. This allows to provide information about the trends without being influenced by short-term fluctuations caused by seasonality.
- Provides Long-term Perspective: By comparing data over a full year, YoY analysis offers a long-term perspective on trends and performance. It helps to identify broader patterns and changes in metrics, providing valuable insights into overall progress or changes in a business.
- Does Not Require Complex Calculation Methods: YoY analysis is a straightforward comparisons between different years. This makes it easy to assess whether performance has improved or declined over time. This makes this a simple but yet useful tool for tracking progress towards goals or benchmarks.
- Identifies Growth Trends which Easily Comparable: YoY analysis highlights growth trends by showing whether metrics are increasing or decreasing compared to the previous year. This is particularly valuable for assessing the effectiveness of growth strategies and initiatives over time.
- Useful for Bench-marking: YoY analysis allows businesses to benchmark their performance against previous years, industry standards, or competitors. It provides a basis for evaluating whether a company is performing better or worse relative to its peers.
Cons of Year Over Year (YoY) Analysis
- Could Mask Short-term Changes: YoY analysis provides a long-term perspective. Hence with this, it could mask short-term changes or fluctuations in data. This can make it challenging to identify and respond to immediate issues or opportunities that arise within the year.
- Not Suitable for All Metrics: YoY analysis is most effective for metrics that exhibit consistent patterns or trends over time. YoY analysis may not provide meaningful insights and could lead to misinterpretation of data for metrics with high volatility or irregular patterns.
- Dependent on Historical Data Quality: YoY analysis relies on accurate historical data for comparison. If historical data is incomplete, inaccurate, or inconsistent, it can affect the reliability and usefulness of YoY comparisons. Hence this is not suitable for startup companies since no previous stats available.
- Doesn’t Account for External Factors: YoY analysis focuses solely on changes within the business over time and may not account for external factors that influence performance, such as changes in the economy, industry dynamics, or regulatory environment.
- Limited to Annual Comparison (Can only measure two events): YoY analysis compares data from one specific period to the same period in the previous year. This limits its ability to capture changes that occur at different times of the year or to assess performance on a more granular level.
Real-World Examples of Companies that have Effectively Leveraged YoY Analysis
1. Amazon
- Example: Amazon is known for its data-driven approach to decision-making, and YoY analysis plays a significant role in its strategy. The company regularly analyzes YoY trends in sales, customer engagement, and operational metrics to identify growth opportunities, optimize pricing strategies, and enhance customer experience.
- Impact: By leveraging YoY analysis, Amazon has been able to make data-driven decisions that fuel its continuous growth and expansion into new markets. For example, it uses YoY data to refine its inventory management, improve product recommendations, and tailor its marketing efforts to specific customer segments.
- Reference: Amazon stated in their news release in aboutamazon.com that “AWS segment sales increased 13% year-over-year to $90.8 billion“.
2. Netflix
- Example: Netflix relies heavily on data analytics to drive content creation, user engagement, and subscriber growth. YoY analysis is integral to its strategy for evaluating the performance of original content, tracking subscriber churn rates, and identifying emerging trends in viewer preferences.
- Impact: By analyzing YoY trends in viewer engagement and subscription metrics, Netflix can make data-driven decisions about content investments, pricing strategies, and international expansion. For example, it uses YoY data to determine which original series or movies resonate most with viewers and prioritize investments accordingly.
- Reference: Netflix Research Analytics – research.netflix.com
3. Walmart
- Example: As one of the world’s largest retailers, Walmart utilizes YoY analysis extensively to optimize its operations and drive sales growth. The company analyzes YoY trends in sales, inventory turnover, and customer behavior to identify opportunities for improving efficiency, enhancing product assortment, and tailoring promotions.
- Impact: By leveraging YoY analysis, Walmart has been able to make strategic decisions that drive revenue growth and improve customer satisfaction. For instance, it uses YoY data to forecast demand for seasonal products, adjust pricing strategies based on competitor trends, and optimize its supply chain operations to reduce costs.
- Reference: Walmart 2023 Annual Report
4. Google
- Example: Google employs YoY analysis to evaluate the performance of its advertising platforms, measure user engagement across its various products and services, and track trends in online search behavior. By analyzing YoY data, Google can identify emerging market trends, refine its algorithms, and optimize ad targeting strategies.
- Impact: By leveraging YoY analysis, Google can make data-driven decisions that drive revenue growth and enhance user experience. For example, it uses YoY data to identify changes in user search behavior, adjust its algorithms to deliver more relevant search results, and optimize ad placements to maximize click-through rates.
How can I use the Output of YoY to Grow my Business?
You can leverage the output of Year-over-Year (YoY) analysis to grow your business by gaining valuable insights into performance trends and areas for improvement. By identifying which metrics are experiencing growth or decline over time, you can adjust strategies to capitalize on successful initiatives or address challenges. For instance, if YoY analysis reveals a consistent increase in revenue from a particular product or market segment, you can allocate resources towards expanding those areas further. Conversely, if there’s a decline in profitability, you can investigate the underlying causes and implement corrective actions. Additionally, YoY analysis helps in setting realistic goals and benchmarks for future growth, enabling you to make informed decisions and drive sustainable business expansion.
Best Practices when Calculating the YoY Analysis
It is recommended to follow the below best practices when calculating Year-over-Year (YoY) analysis,
- Consistent Timeframes: Use consistent timeframes for comparing data from consecutive years. Whether you’re analyzing quarterly, monthly, or annual data, ensure that you’re comparing the same periods across years to avoid distortions in the analysis.
- Data Quality Assurance: Verify the accuracy and completeness of the data before conducting YoY analysis. Ensure that data collection methods and reporting standards remain consistent over time to maintain the integrity of comparisons.
- Adjust for Seasonality: Account for seasonal variations by adjusting for factors that may influence the data, such as holidays, weather patterns, or industry-specific cycles. This ensures that YoY comparisons reflect underlying performance trends rather than short-term fluctuations.
- Normalize Data: Normalize data when necessary to account for changes in business conditions, such as inflation or changes in accounting methods. Adjusting for these factors helps in making more accurate comparisons and interpreting YoY changes appropriately.
- Use Percentage Changes: Express YoY changes as percentage changes to facilitate comparison and interpretation. Percentage changes provide a standardized metric for evaluating growth or decline, regardless of the scale of the data.
- Consider Multiple Metrics: Evaluate YoY changes across multiple relevant metrics to gain a comprehensive understanding of business performance. Comparing various indicators allows for a more nuanced analysis and helps in identifying areas of strength or weakness.
- Contextualize Findings: Provide context for YoY analysis by considering external factors that may influence performance trends, such as market conditions, regulatory changes, or competitive landscape shifts. Contextualization enhances the interpretation of YoY changes and informs strategic decision-making.
- Visualize Data: Visualize YoY changes using charts, graphs, or dashboards to enhance comprehension and facilitate communication of insights. Visual representations make it easier to identify trends, patterns, and outliers in the data.
Learn More: